A collection of thoughts, findings, and projects
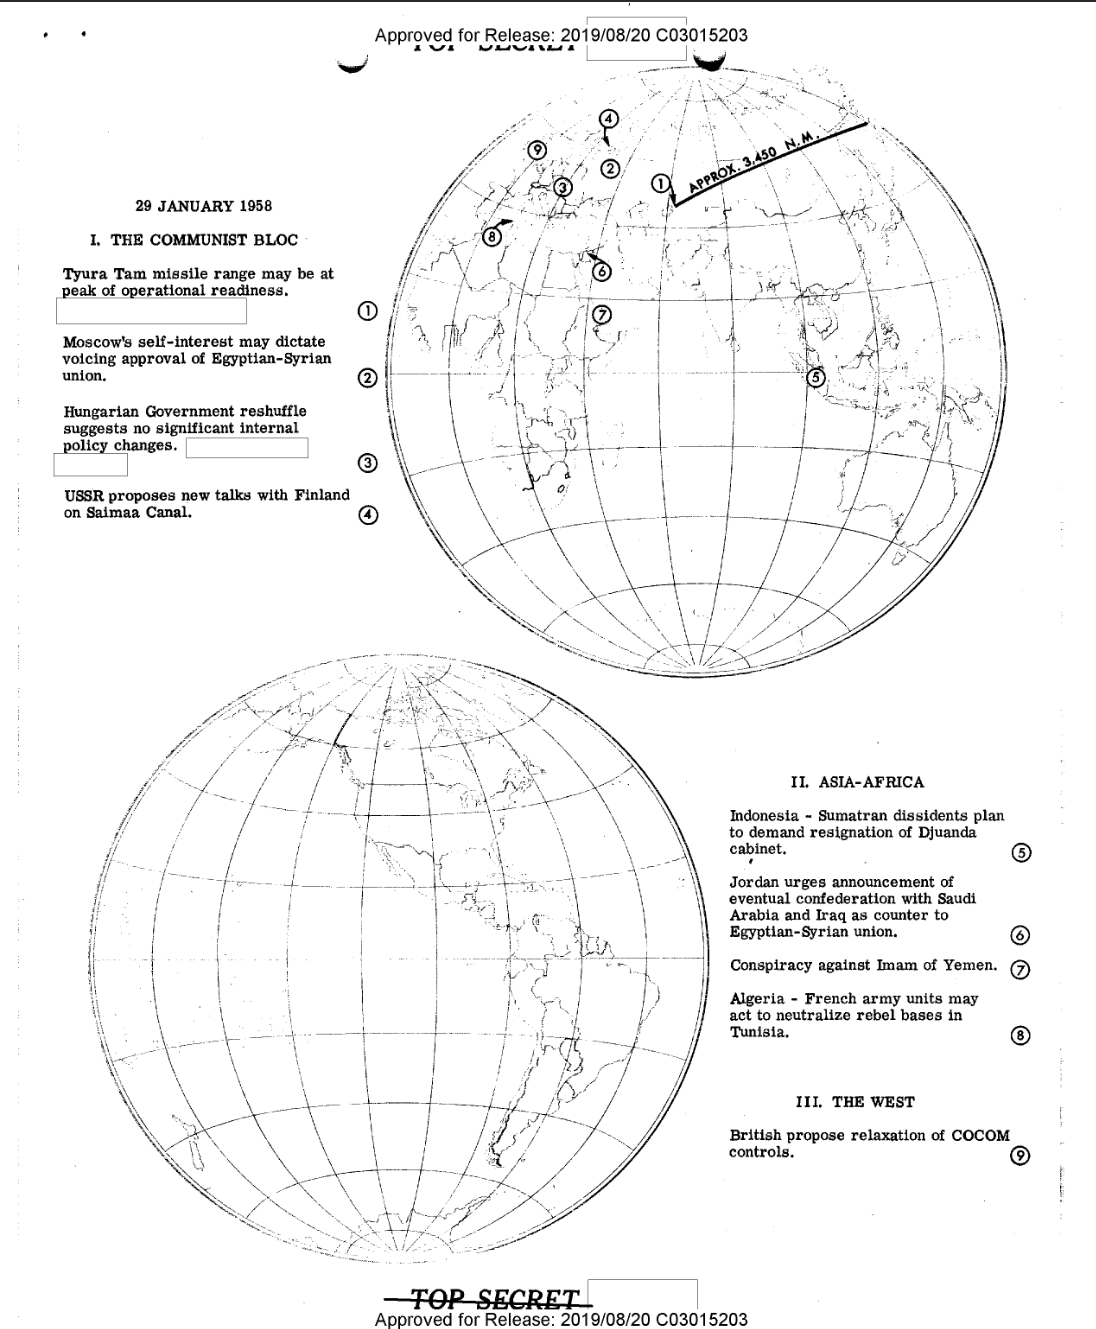
In this project, I scraped 2809 declassified CIA briefings to the president from the 1950s and examined the data using a variety of Natural Language Processing (NLP) techniques.
I chose this dataset because it seemed perfect for experimenting with NLP -- reading all of these briefs and identifying patterns would be immensely time-consuming, and it would be easy to miss larger themes. THis is where NLP can be useful.
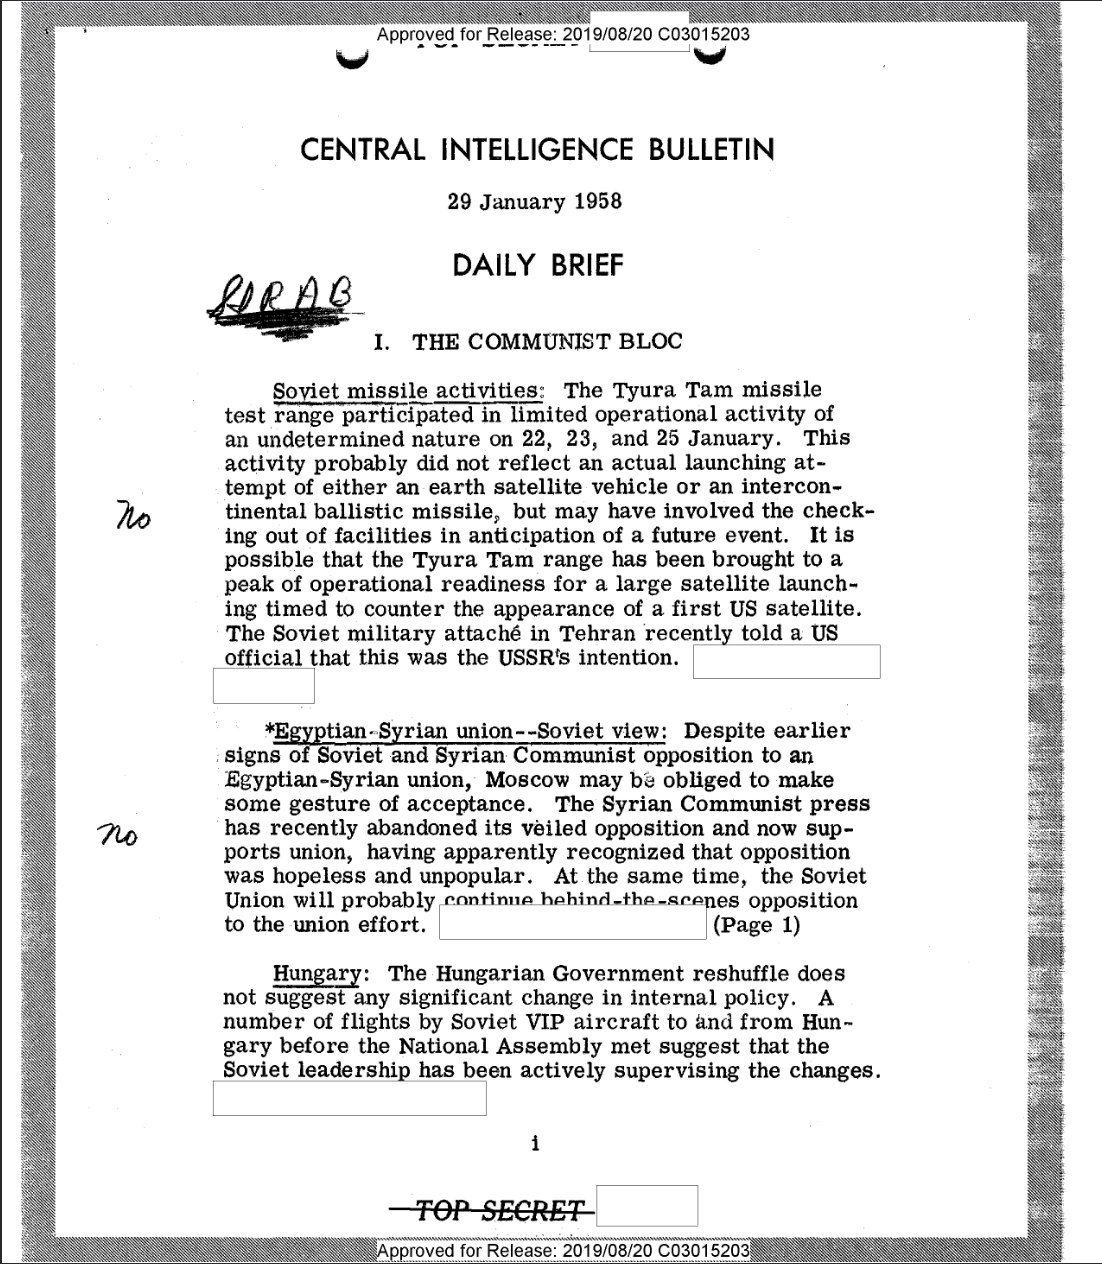
First, I used the Python module BeautifulSoup (though in hindsight, I really regret not looking into Scrapy) to scrape the CIA website, which does not prohibit web-scraping.
Once I had the data, which were scans in PDF format, I transferred it to plaintext and did a bit of pre-processing before exploring it.
Pre-processing included removing random noise from the original document (smudges from photocopies and stamps showed up as gibberish and random punctuations when transferred to plaintext), removing common words with little meaning (stop words), spellchecking and lemmatizing the rest of the words (putting words in their root form).
Spellchecking was the most computationally expensive step in this process. Because the documents were photoscans from the 1950s, a lot of words transferred to text incorrectly. For example, the word 'example' may have been coded as '3x ample' or 'exmq1e'.
To get around this, I created a function that checked the word similarity of every word to known words using the Python modules Gensim and Textblob. If there was a match of over 90%, the correctly spelled word was used. Otherwise, the word was abandoned.
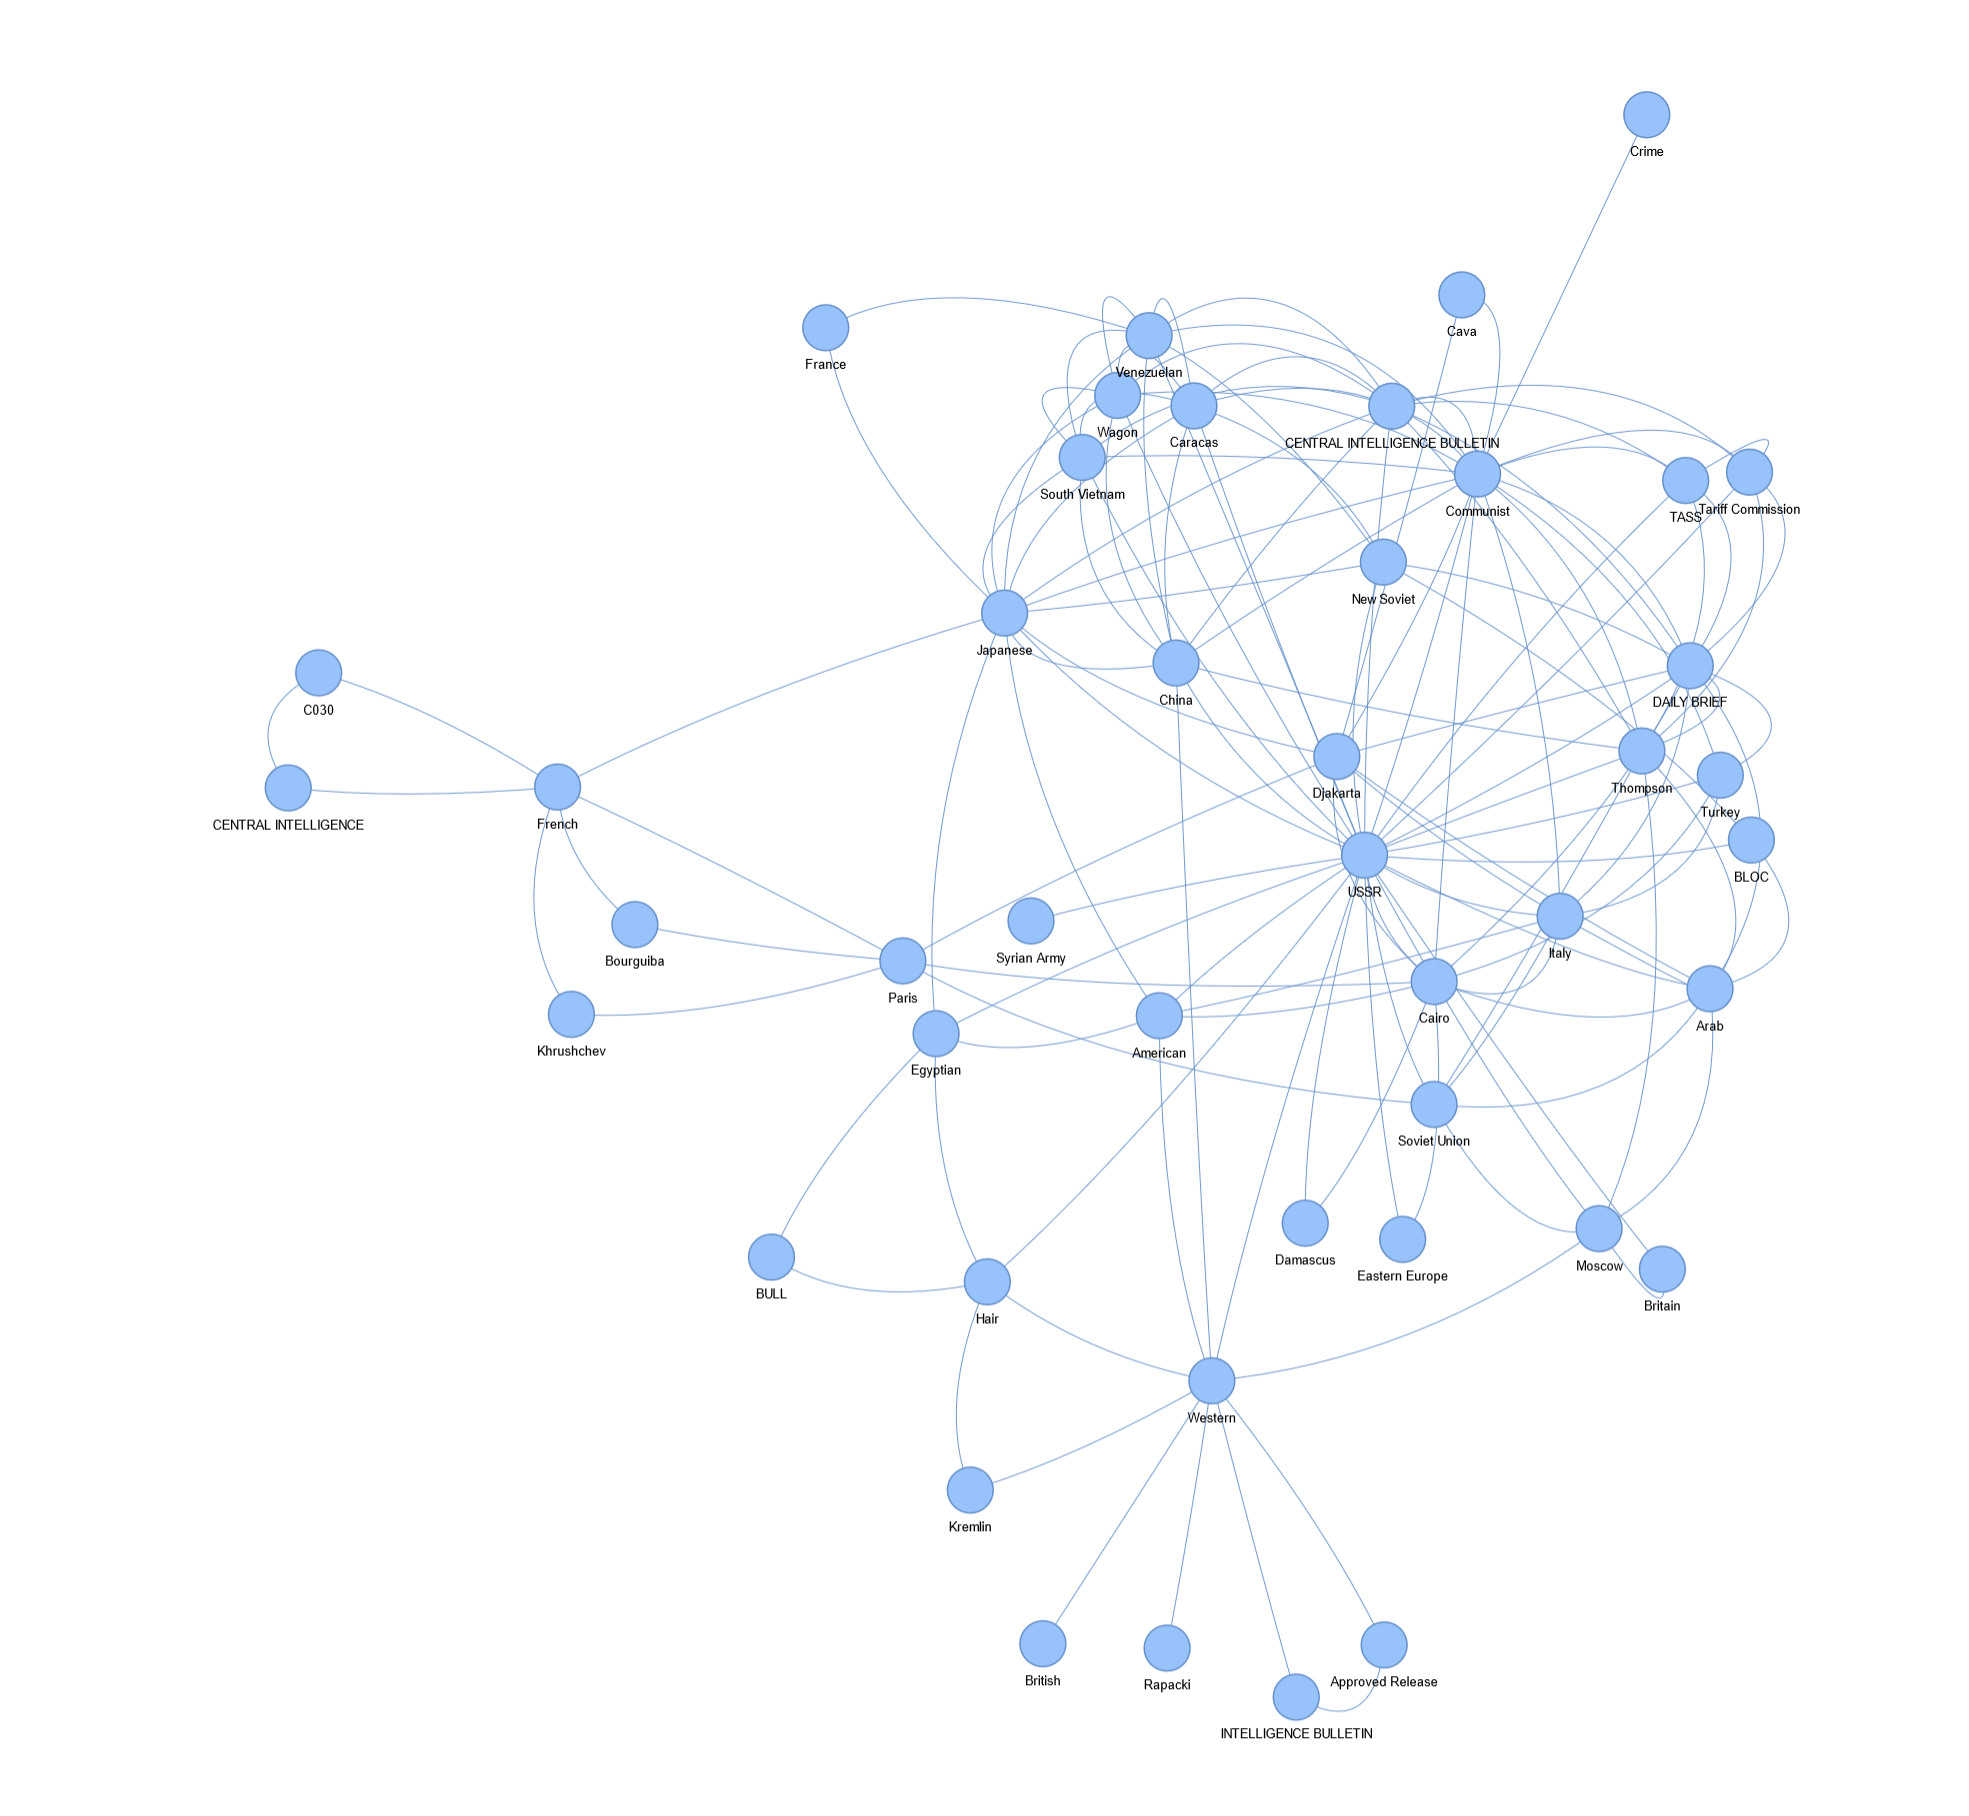
This graph shows the connections between terms like names, organizations, events, and locations. It was created using the Python modules Pyvis and Spacy.
First, I used Spacy to create a list of named entities within the text (such as names and locations). Anytime more than one named entity appeared within a section of a document, a relationship was recorded. This data was then used in Pyvis to create this graph.
Obviously, nuance and meaning is lost in this graph. Additionally, other than weeding out entities like ordinal numbers and money, I used default named entity recognition settings in Spacy, which can make mistakes.
If all of the connections were shown, the map would be too tangled. Therefore, only the most frequent connections are shown in this graph. In this case, all of these connections appeared at least 250 times.
Here is a graph that included connections that appeared at least 150 times.
Despite these limitations, this graph does give a sense of a few major topics within the speech.
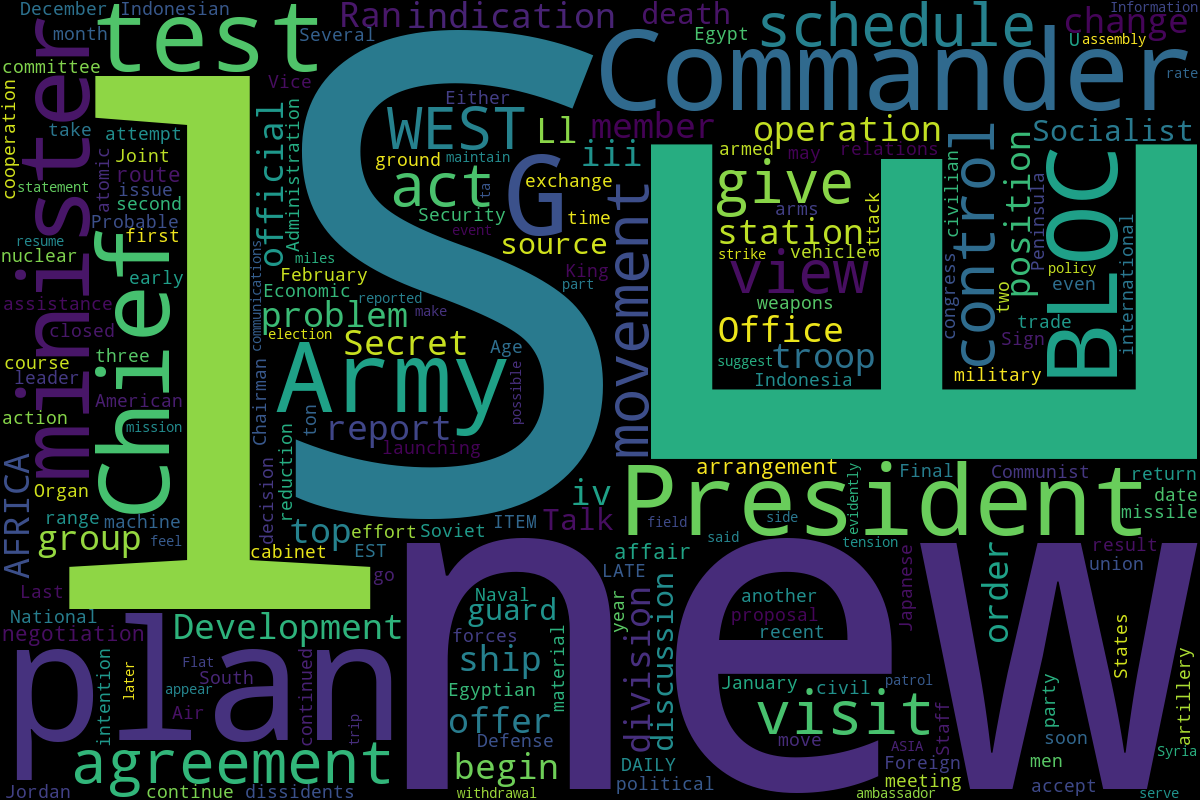
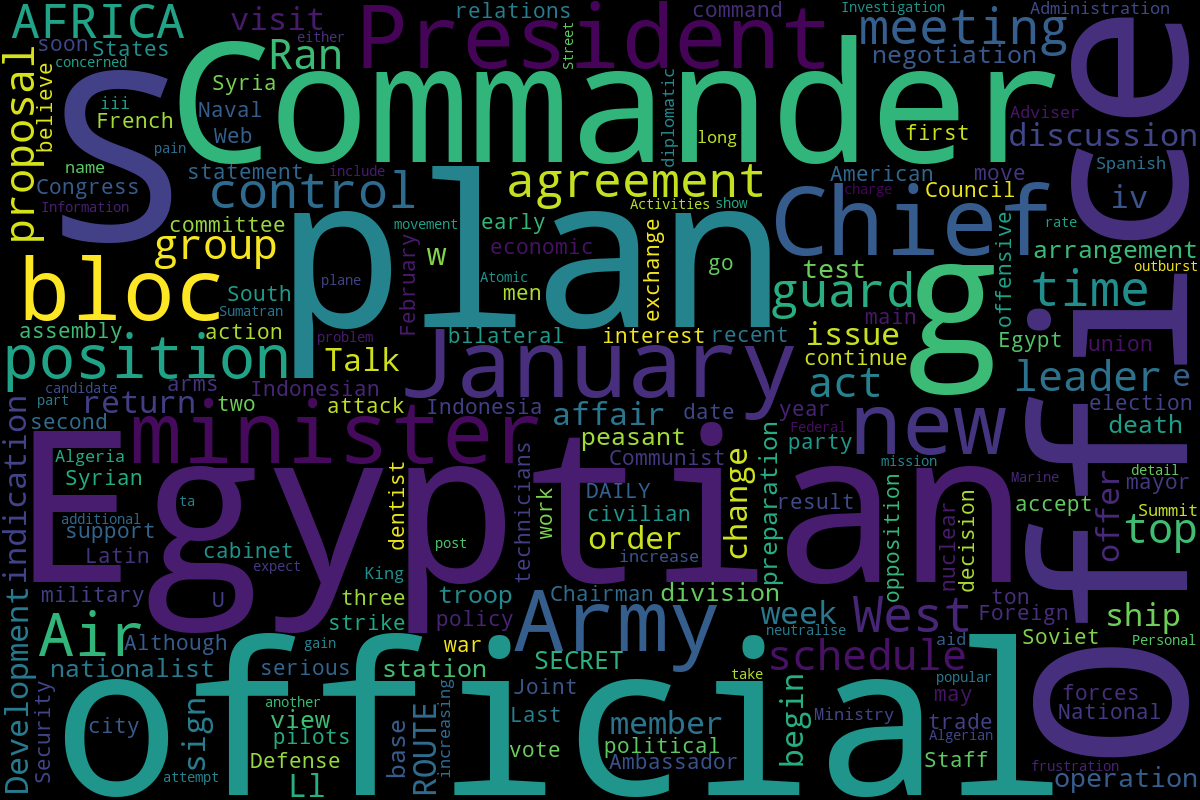
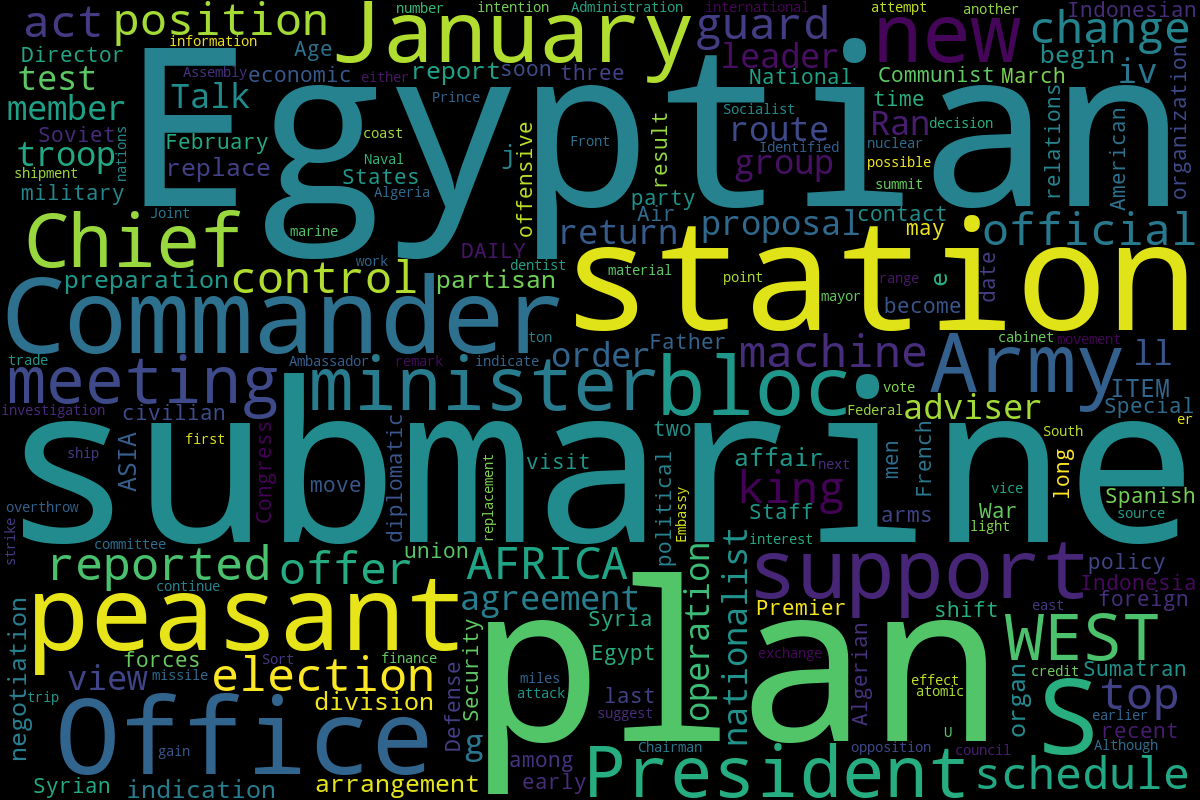
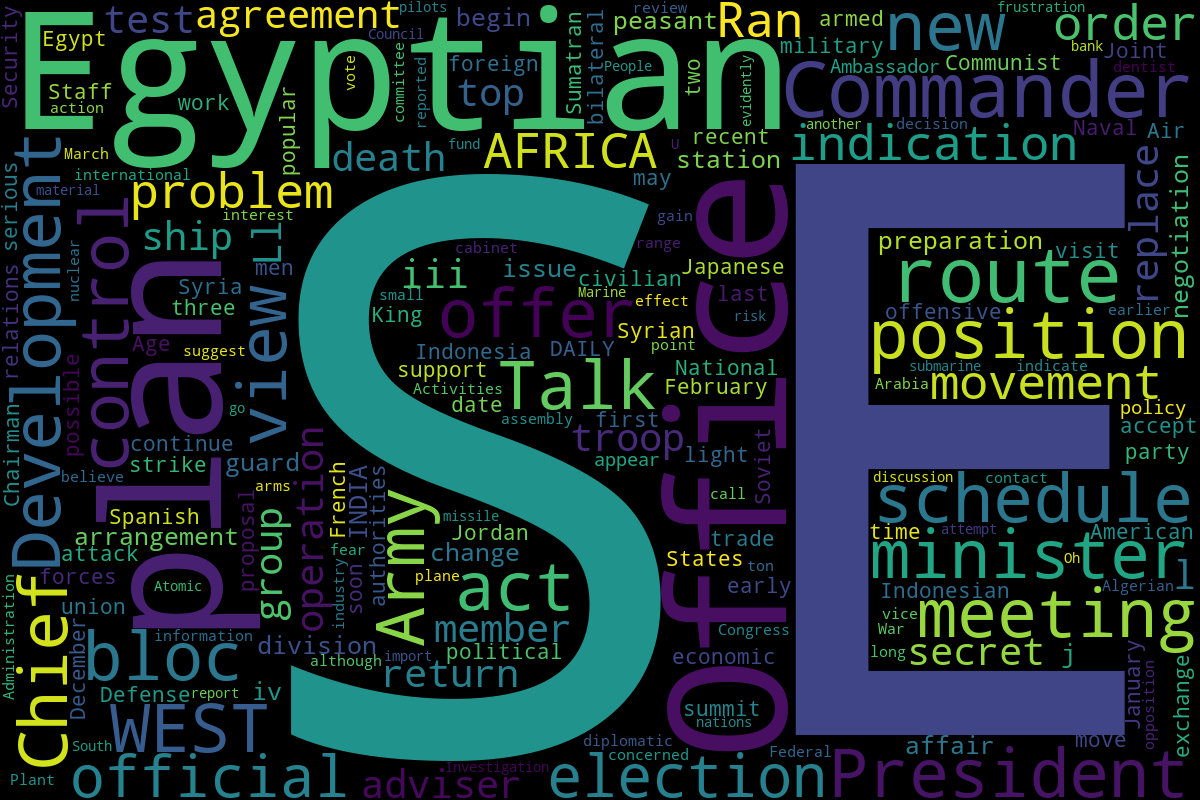
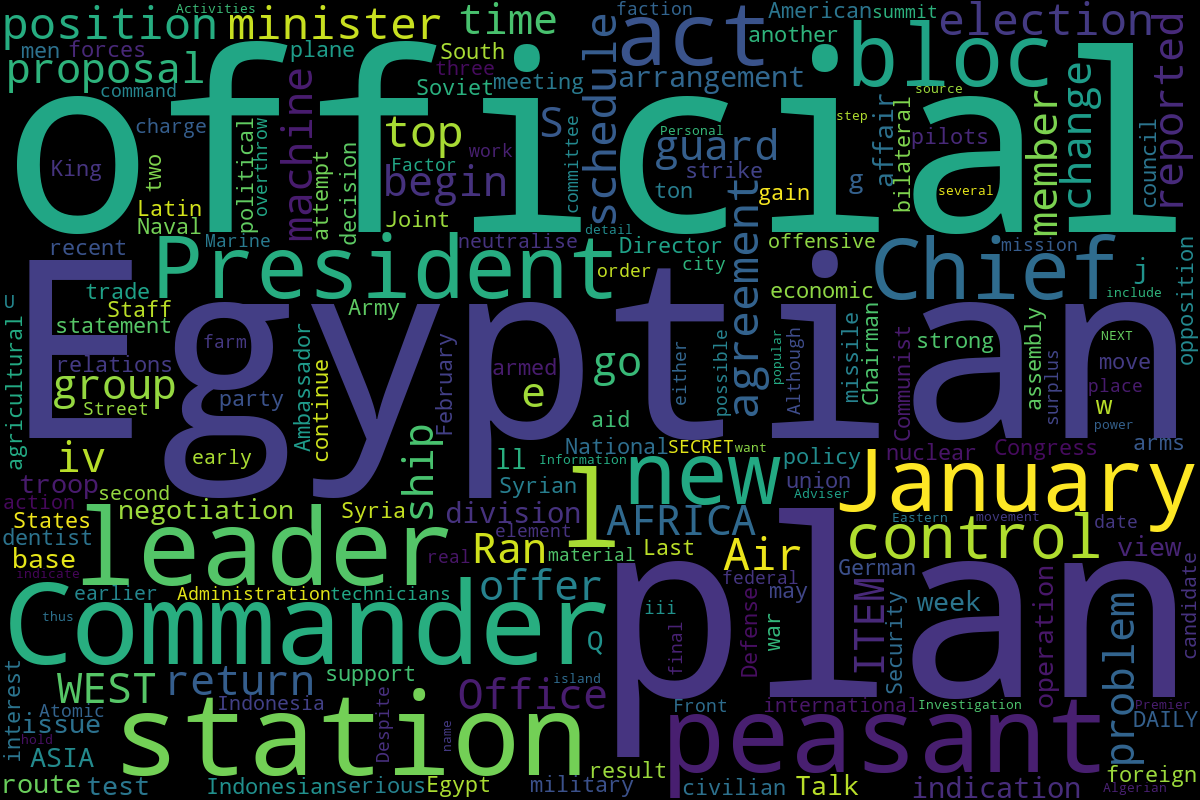
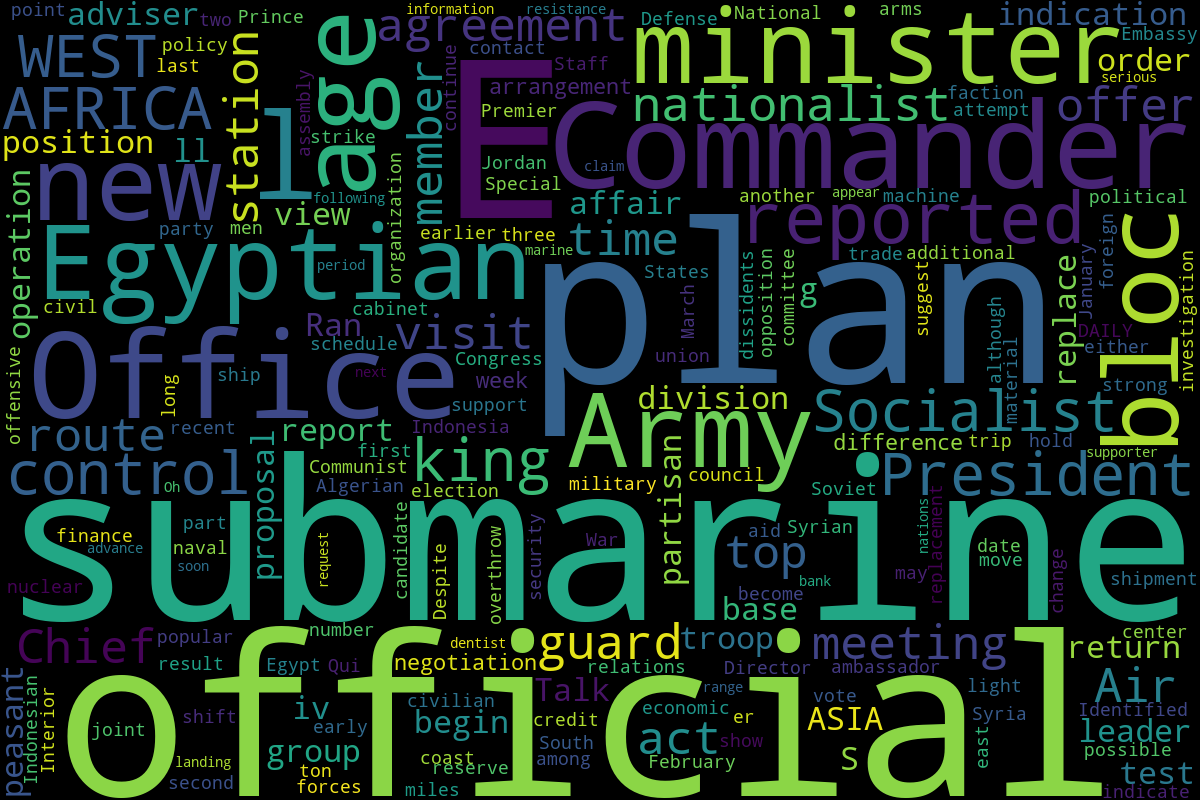
These visualizations use the LDA algorithm to show some of the major themes in the documents.
This algorithm is used to break down data into topics/categories. It was first used in genetics and later applied to NLP.
To me, Word Clouds communicated the findings most effectively. However, I also thought pyLDAvis was an interesting visualization of this data worth including as well.
At first, the Word Clouds were overcrowded with the same words, such as 'intelligence' and 'central'.
However, after a bit of cleaning, more specific words began to emerge, which gave more detailed hints about the general contents of the documents.
This map was created to show which nations appeared in the documents and how frequently they appeared.
This map was created using the Python modules Folium and Spacy.
First, I used Spacy to track mentions of geopolitical entities. Then, I used Folium to indicate these locations as well as their frequency on a choropleth map.
One additional step that I took in generating this map was to match geopolitical entities that weren't modern-day nations with the appropriate label.
For example, Tthe USSR would be marked as Russia.
One significant limitation is that the names of provinces and natural geographic areas are ignored.
Another limitation of this map is that the time period of when nations were mentioned was ignored as well.
Sometimes primary source documents, like the declassified documents examined here, can have details missed in secondary sources like textbooks.But, as stated before, 2809 documents is a lot of dry reading to go through!
After looking at these visualizations, a few details stuck out.
First, Egypt was really on the minds of the CIA, which is unsurprising given the leadership of Nasser and the Suez Crisis. I had also forgotten how pivotal Indonesia to the US during the Cold War in the 1950s.
Second, Bourguiba and Rapacki seemed to be mentioned frequently. Many secondary sources I'd read in the past didn't focus on Polish or Tunisian history, so I didn't recognize these names, but this analysis showed me influential the CIA believed them to be at the time. I also didn't realize
Finally, I didn't think much about the role of submarines in the 1950s, but they seemed to play a major role in these documents
In a sense, what this analysis did best of all was to point out my blind-spots to me. We all have models of the world and stories about the history of the world in our imaginations that sometimes go unchallenged as we read narratives by similar authors.
This experiment with NLP certainly showed me a few of my blind-spots that I can pursue in my future studies of history: the wight that Indonesia and Tunisia had on the minds of the CIA.
© Copyright Clayton Spencer 2024